Trajan Commercial Real Estate
Miami Industrial Market Update as of March 2024
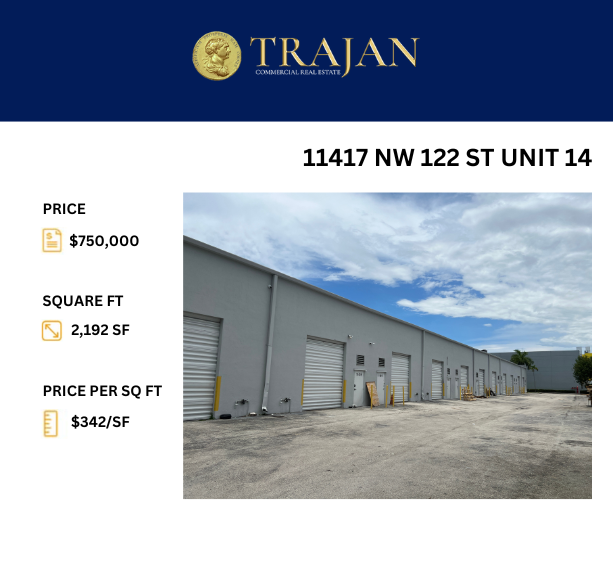
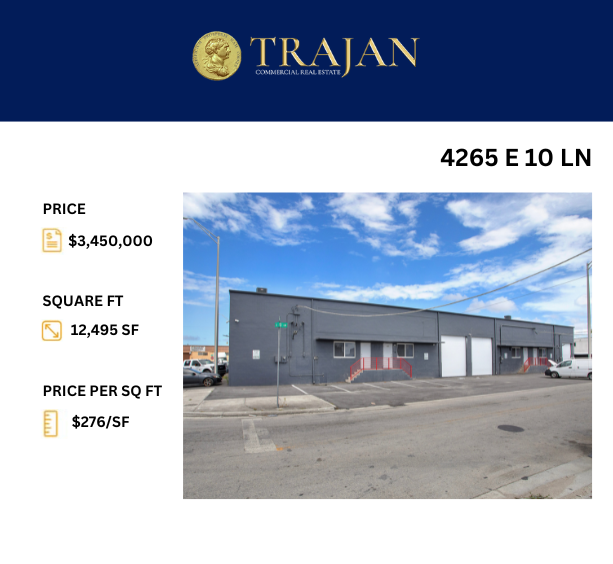
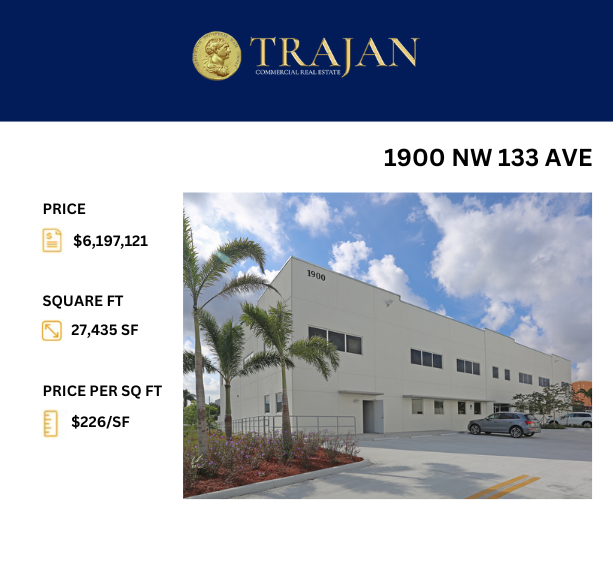
NOTABLE TRANSACTIONS
COMMENTARY
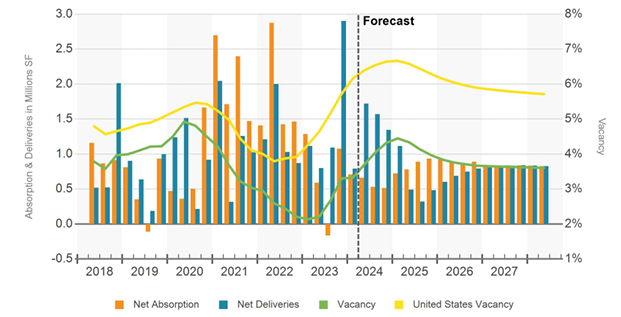
In Miami, modern logistics space remains a prized asset, with a total of 5.9 million square feet currently in development. Despite this, availability remains limited, with existing properties constructed post-2020 boasting a local lease rate exceeding 90%, significantly outperforming the national average of 80%. This scarcity has granted landlords substantial leverage, facilitating a 6.7% uptick in rents over the past year, surpassing the 5.2% growth observed nationally. However, while rental rates surged by 18% year-over-year in the second quarter of 2022, recent trends indicate a slowdown in growth due to moderating tenant demand and increasing vacancies since 2023. This deceleration is expected to persist in 2024, influenced by the anticipated impact of higher interest rates on economic expansion.
The geographical barrier presented by the Everglades has constrained new development in Miami, resulting in a slower expansion of industrial stock compared to the national average and similar-sized markets since 2015. Consequently, supply limitations have consistently maintained vacancy rates well below the national average, a trend projected to continue in the foreseeable future. This scenario is anticipated to bolster rent growth, particularly during 2025-2026, when fewer new developments are slated for completion.
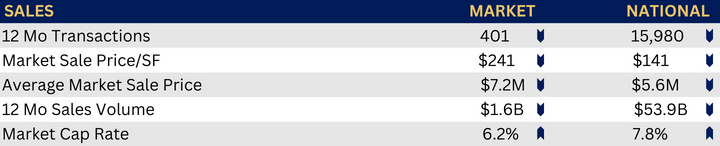
In terms of sales volume, rising interest rates have normalized activity, aligning it with pre-pandemic levels since 2023, following a historic surge in 2021-22. Over the past year, total sales volume reached $1.6 billion, slightly below the five-year average of $1.8 billion.
Notably, Miami has bucked the trend observed in most major U.S. markets, experiencing an acceleration in property sales towards the end of last year. Key players such as TA Realty, Longpoint Realty Partners, Ponte Gadea, and Property Reserve have all executed acquisitions exceeding $25 million since December, indicating sustained investor interest in the region.
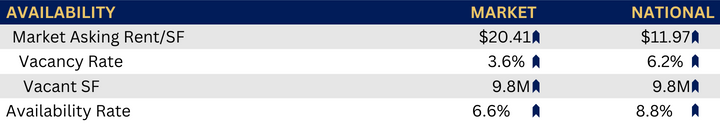
KEY INDICATORS
NET ABSORPTION, NET DELIVERIES & VACANCY
The data within this report is compiled by Trajan Commercial Real Estate using CoreLogic, CoStar and others forms of public and private sources. The data is deemed reliable, but is not guaranteed. The accuracy of the data contained herein can and should be independently verified with the applicable county or municipality.